
prometheus
This plugin exposes metrics in Prometheus Exposition format.
Attributes#
| Name | Type | Requirement | Default | Valid | Description |
|---|---|---|---|---|---|
| prefer_name | boolean | optional | false | When set to true, would print route/service name instead of id in Prometheus metric. |
API#
This plugin will add /apisix/prometheus/metrics to expose the metrics.
The metrics are exposed via a separate Prometheus server address.
By default, the address is 127.0.0.1:9091. You can change it in the conf/config.yaml, for example:
Assume environment variable INTRANET_IP is 172.1.1.1, now APISIX will export the metrics via 172.1.1.1:9092.
Before version 2.6, the metrics are exposed via the data panel port,
you may need to use interceptors to protect it.
If you still want this behavior, you can configure it like this:
How to enable it#
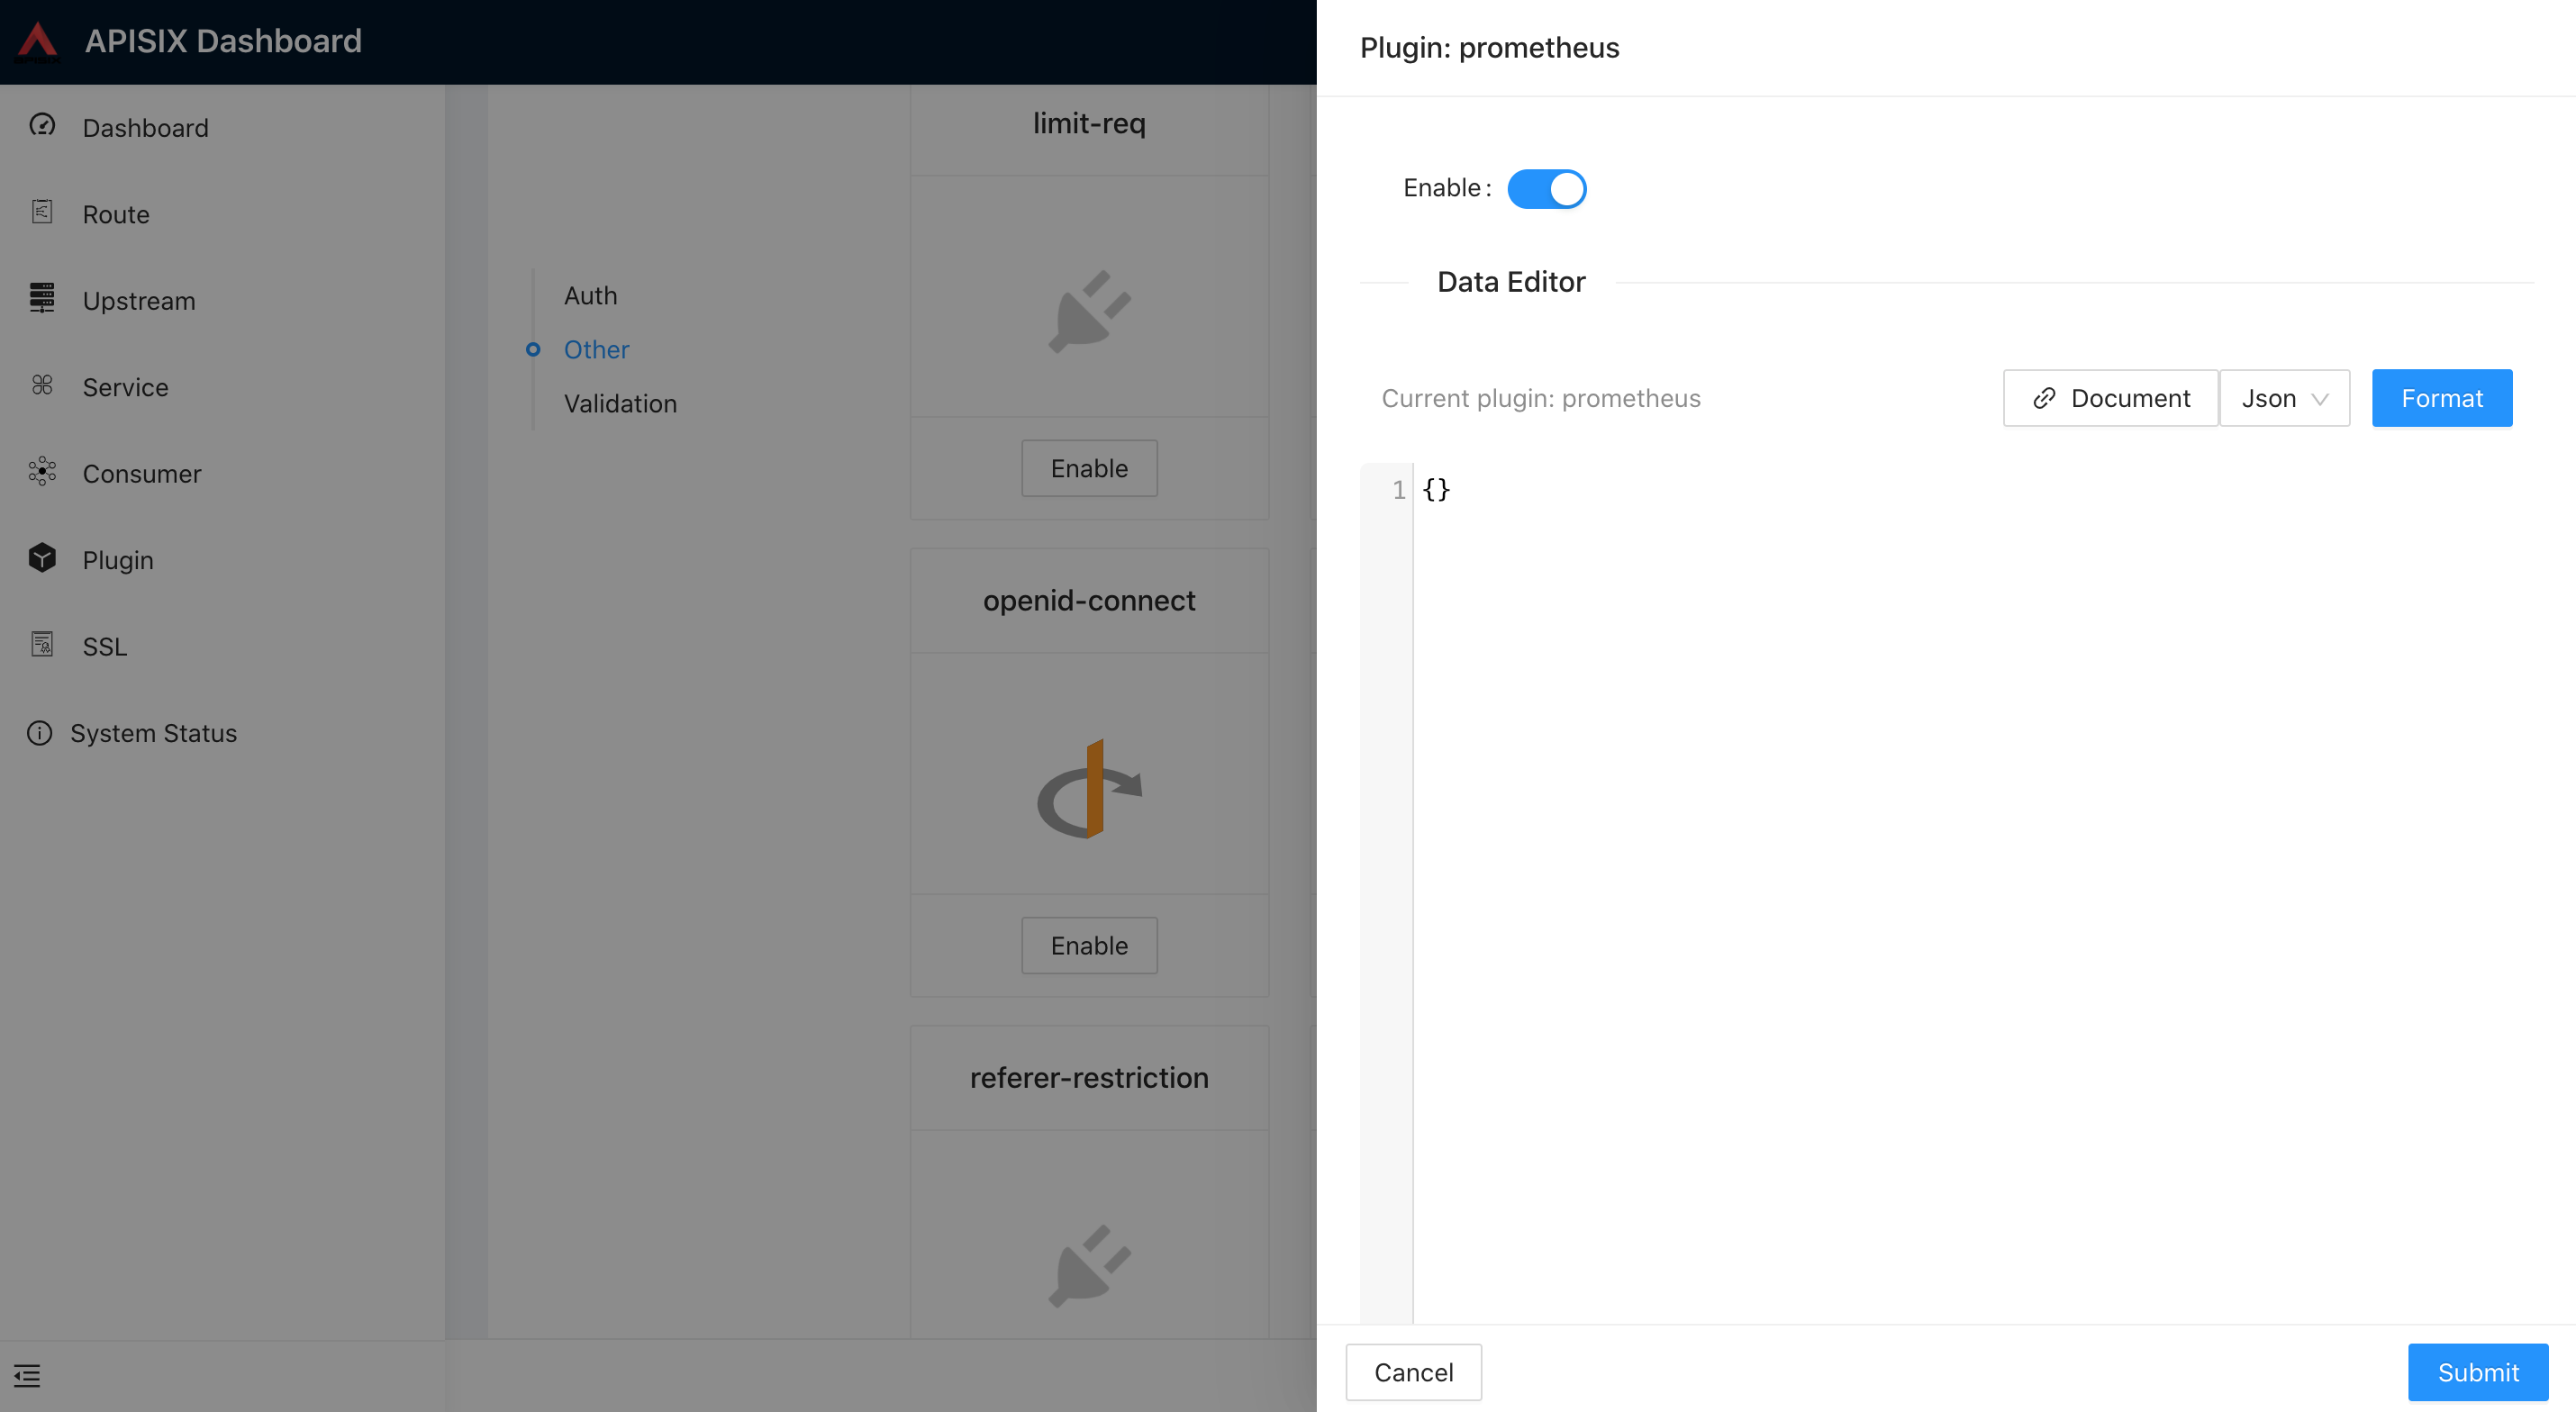
prometheus plugin could be enable with empty table.
Notice, name could be duplicated for multiple routes/services, so when set prefer_name to true, take care of naming format or it could be misleading.
For example:
You can use APISIX Dashboard to complete the above operations through the web console.
First, add a Route:
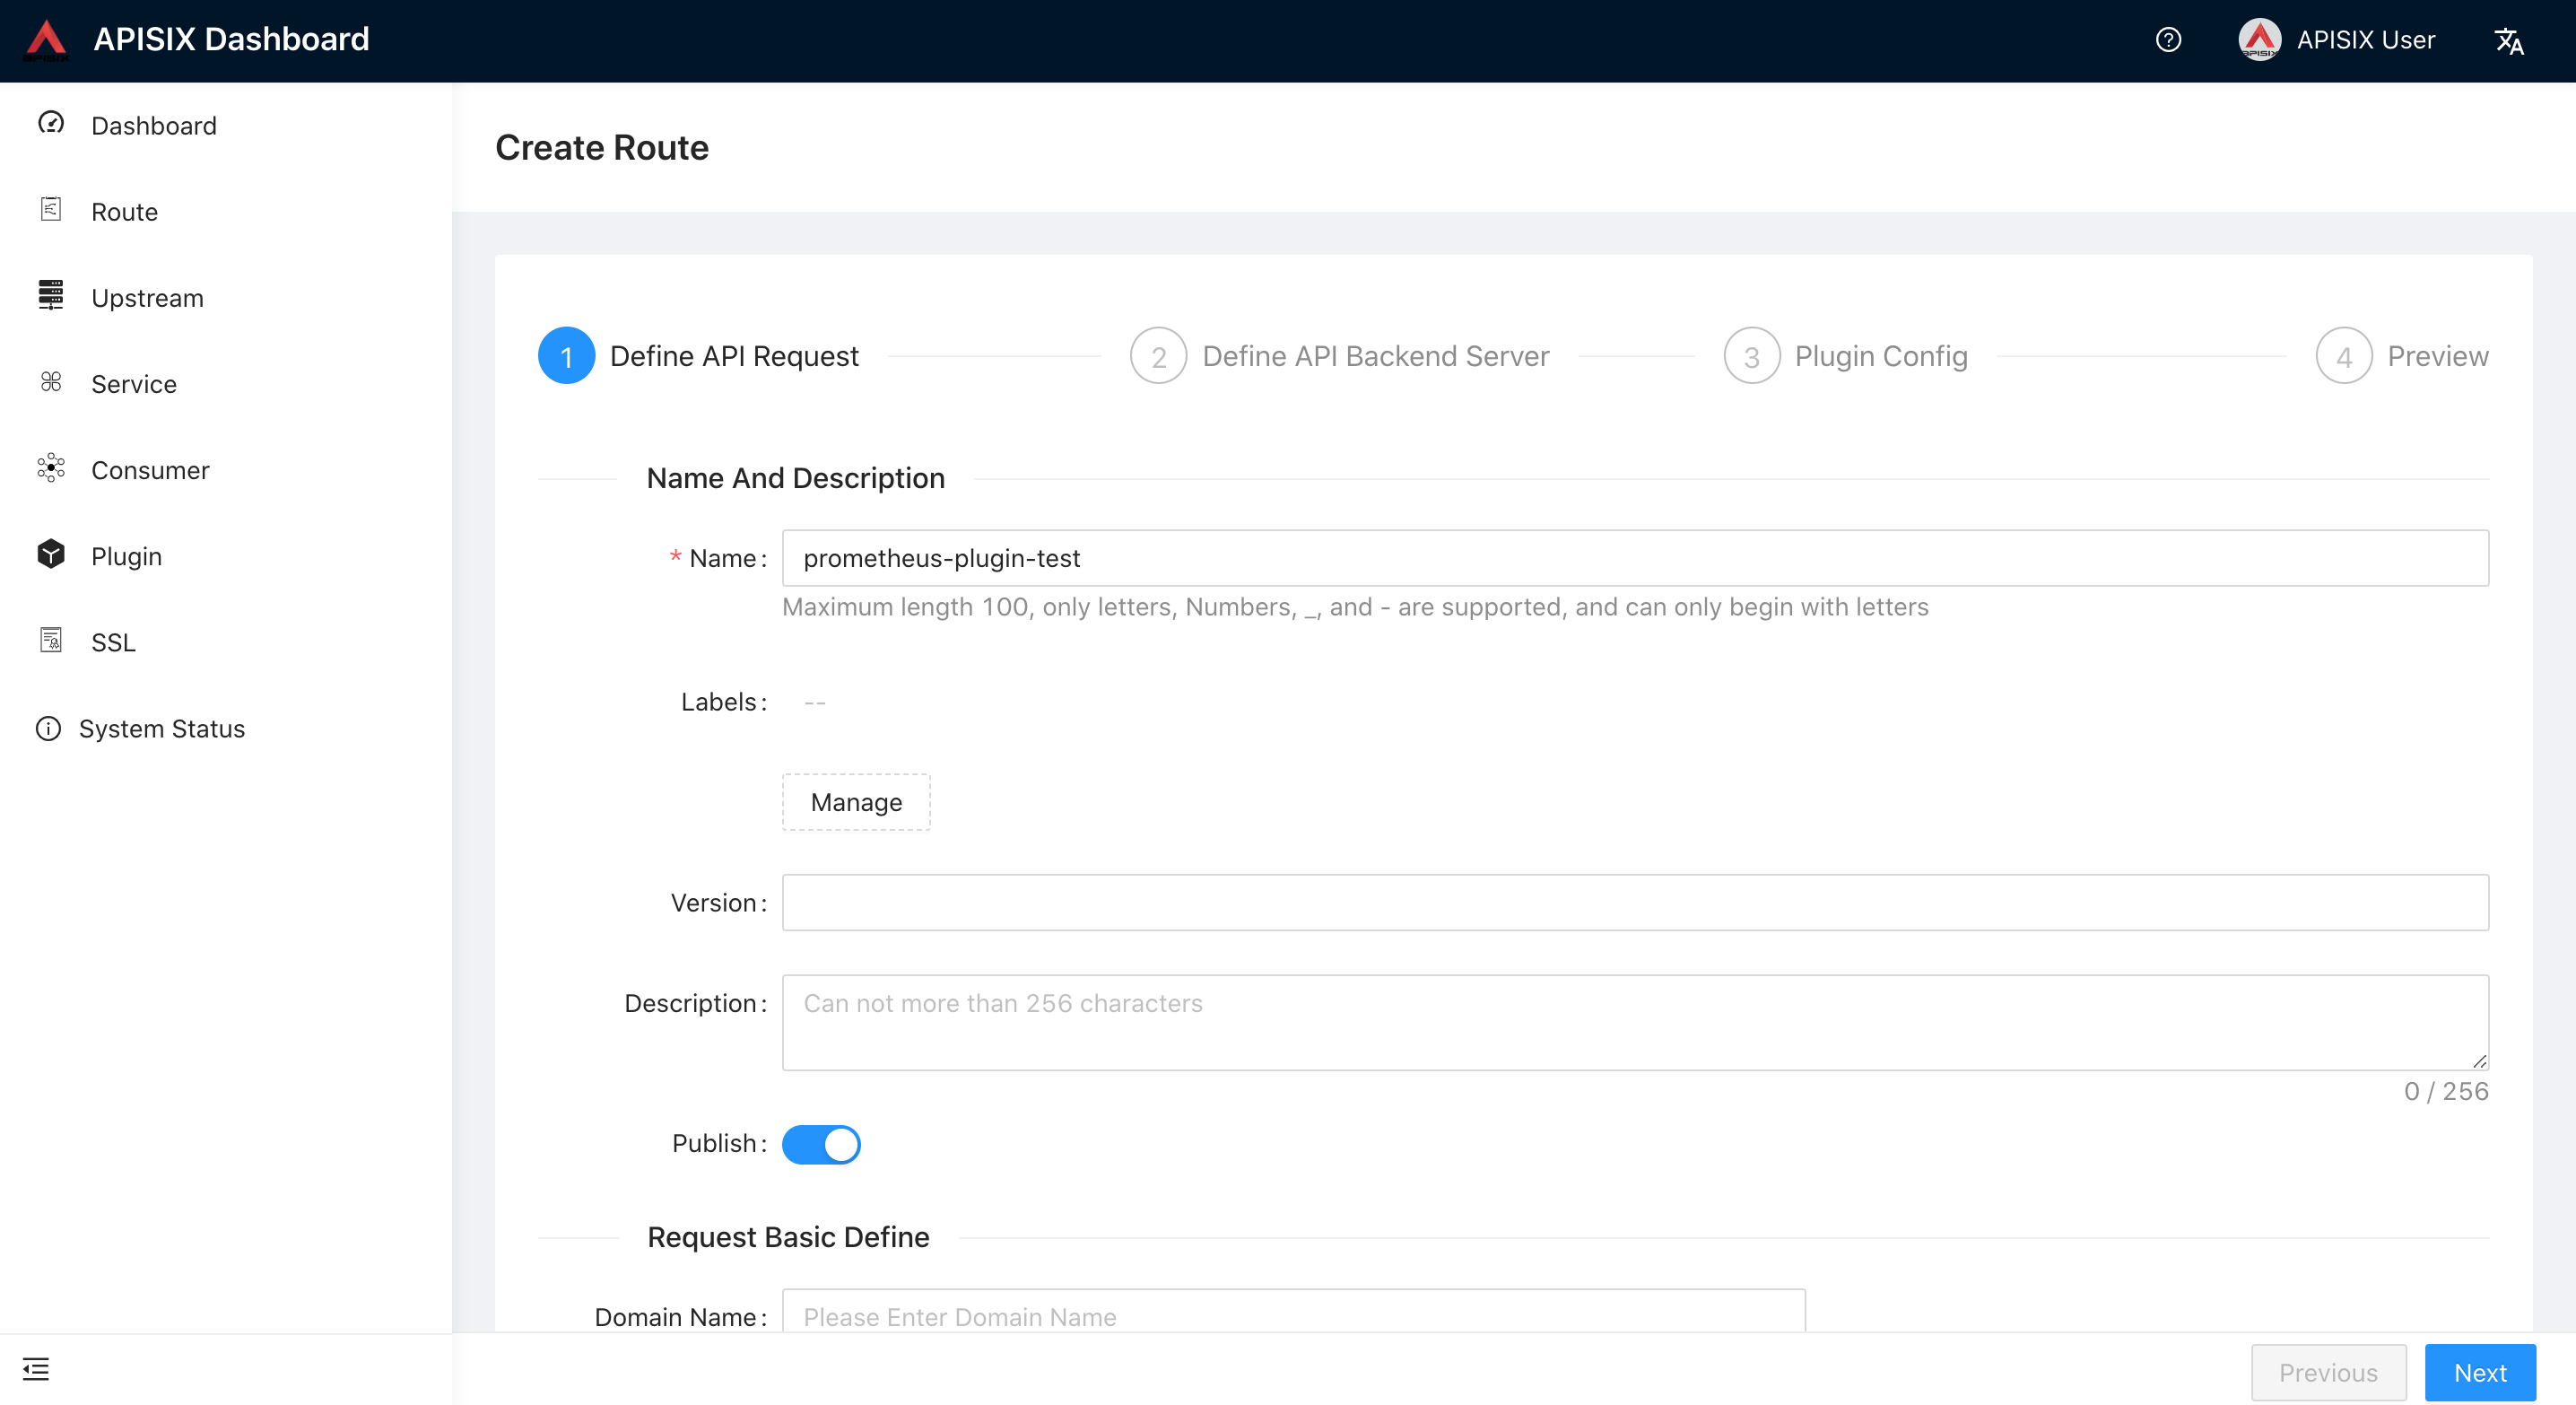
Then add prometheus plugin:
How to fetch the metric data#
We fetch the metric data from the specified url /apisix/prometheus/metrics.
Puts this URL address into prometheus, and it will automatically fetch these metric data.
For example like this:
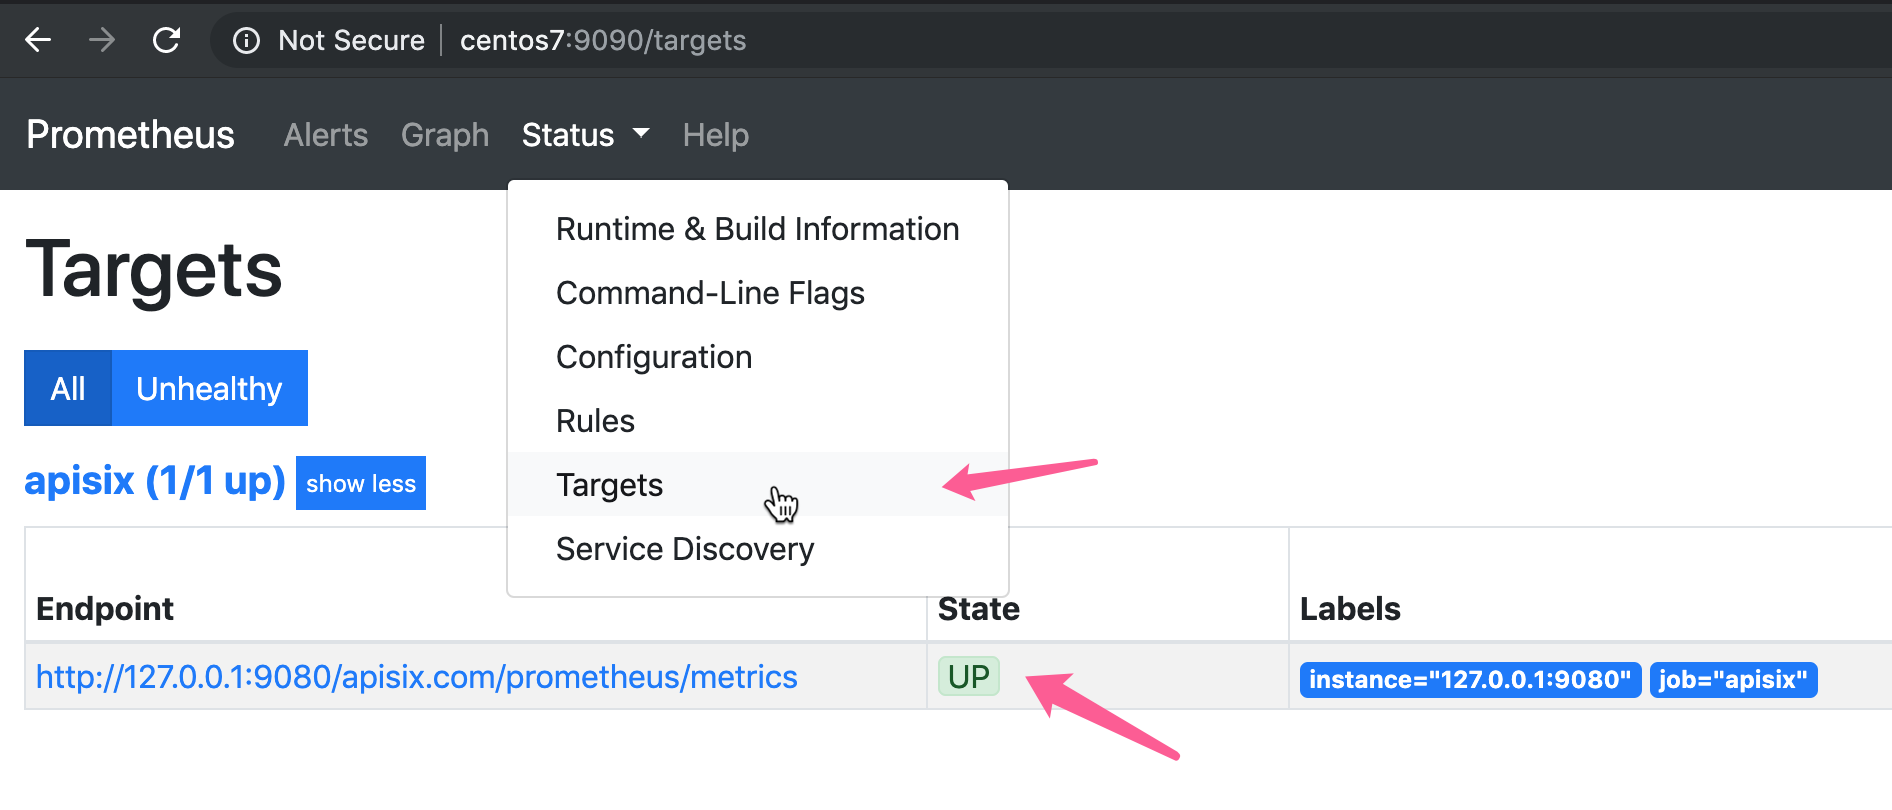
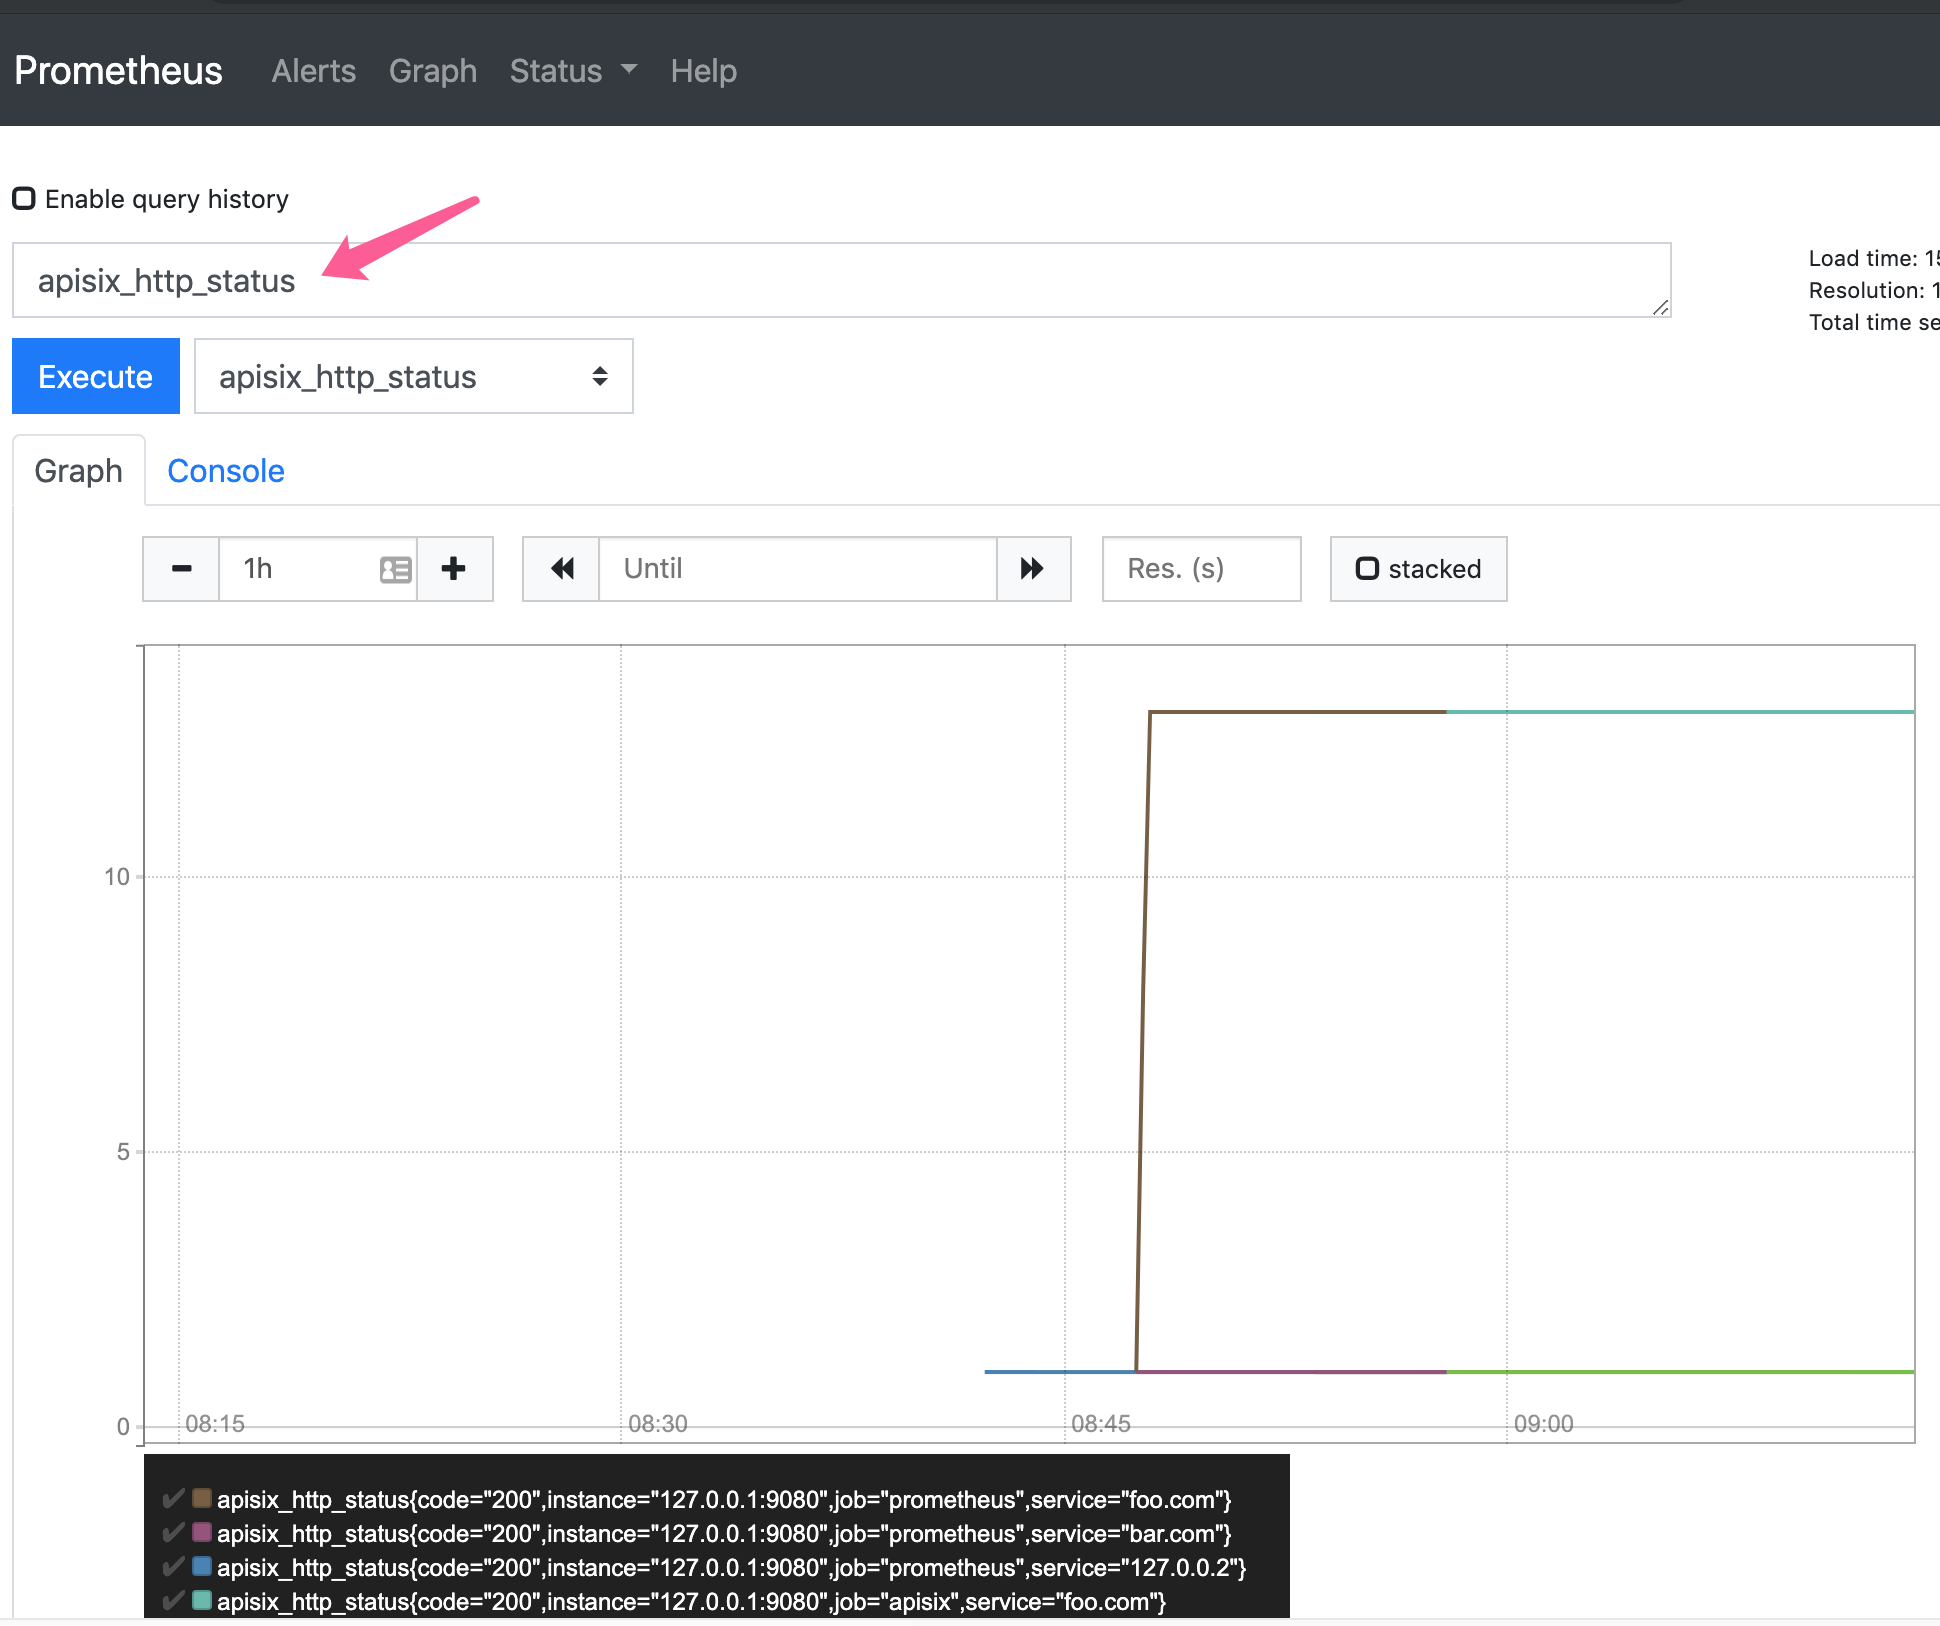
And we can check the status at prometheus console:
How to specify export uri#
We can change the default export uri in the plugin_attr section of conf/config.yaml.
| Name | Type | Default | Description |
|---|---|---|---|
| export_uri | string | "/apisix/prometheus/metrics" | uri to get the prometheus metrics |
Here is an example:
Grafana dashboard#
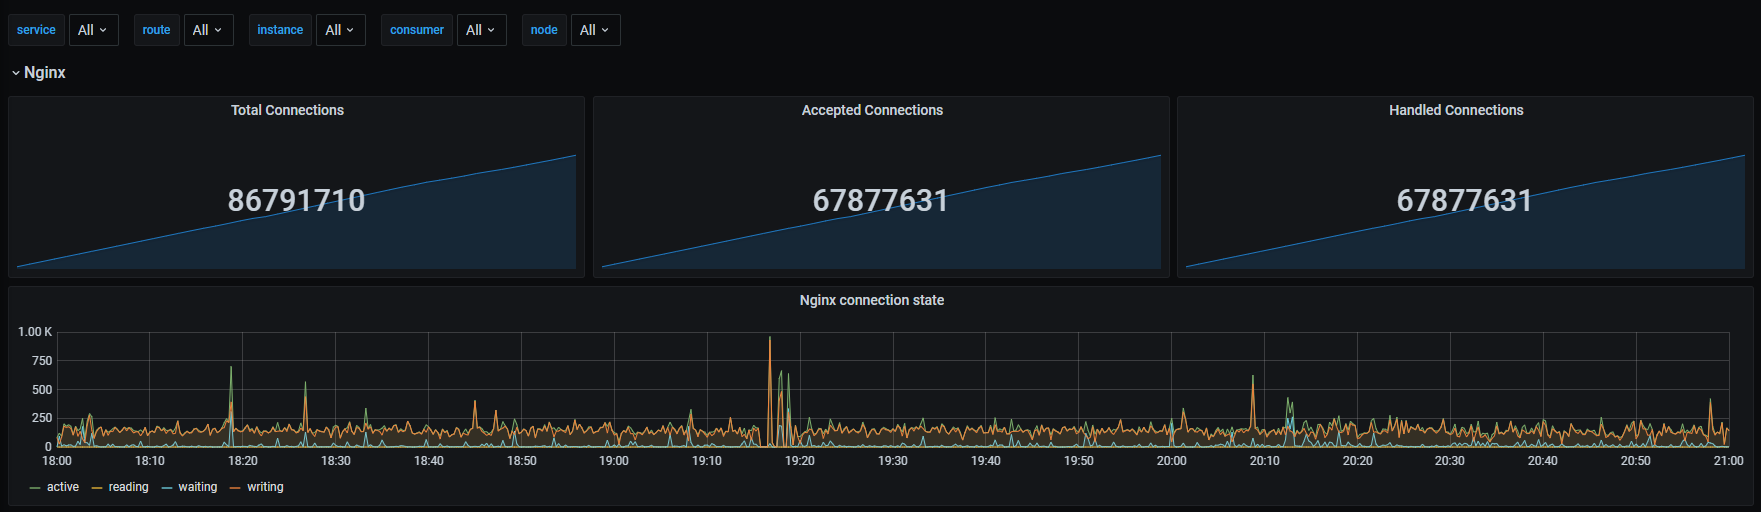
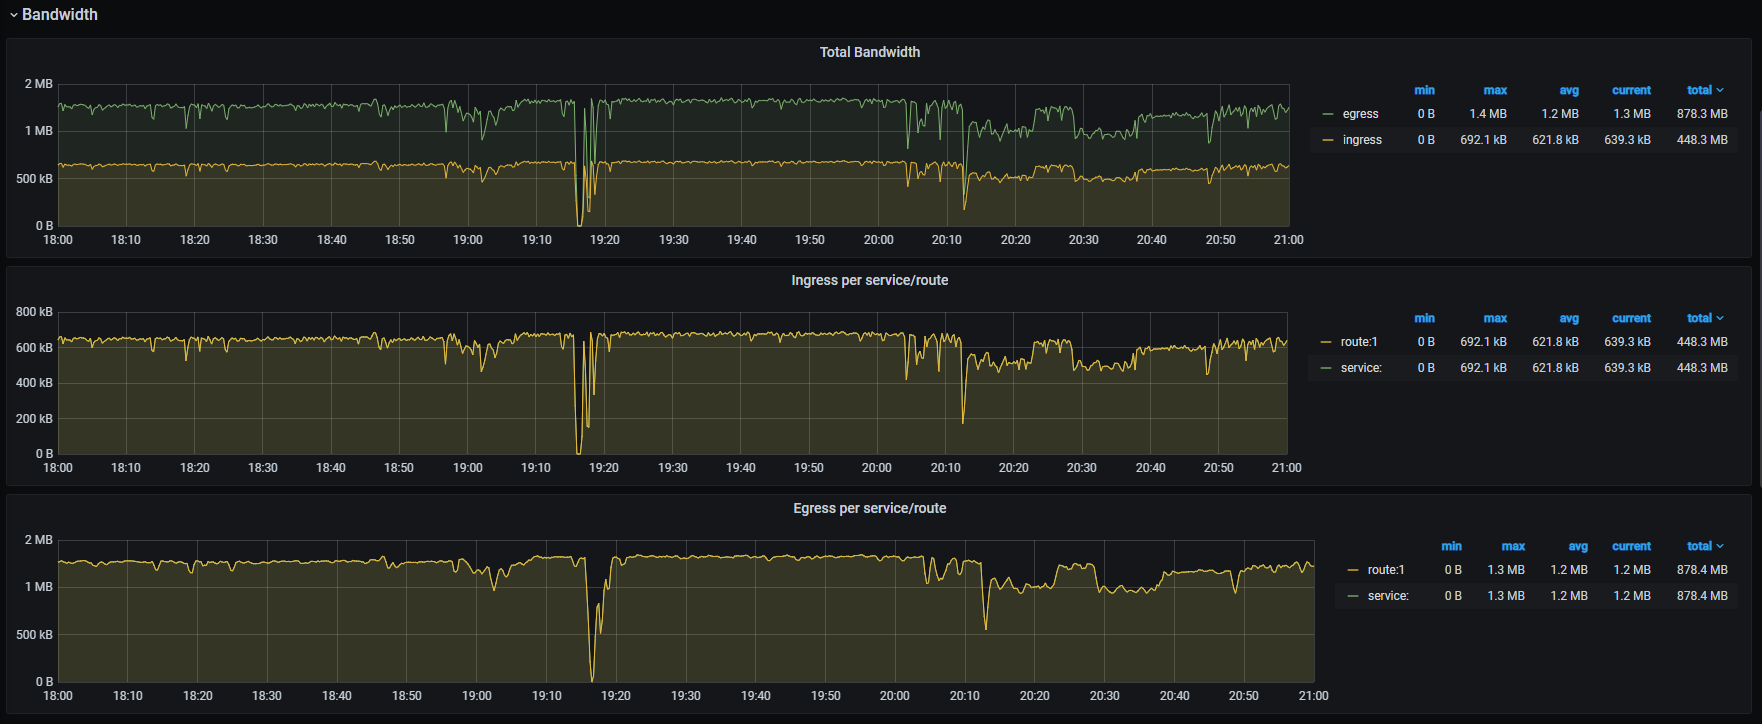
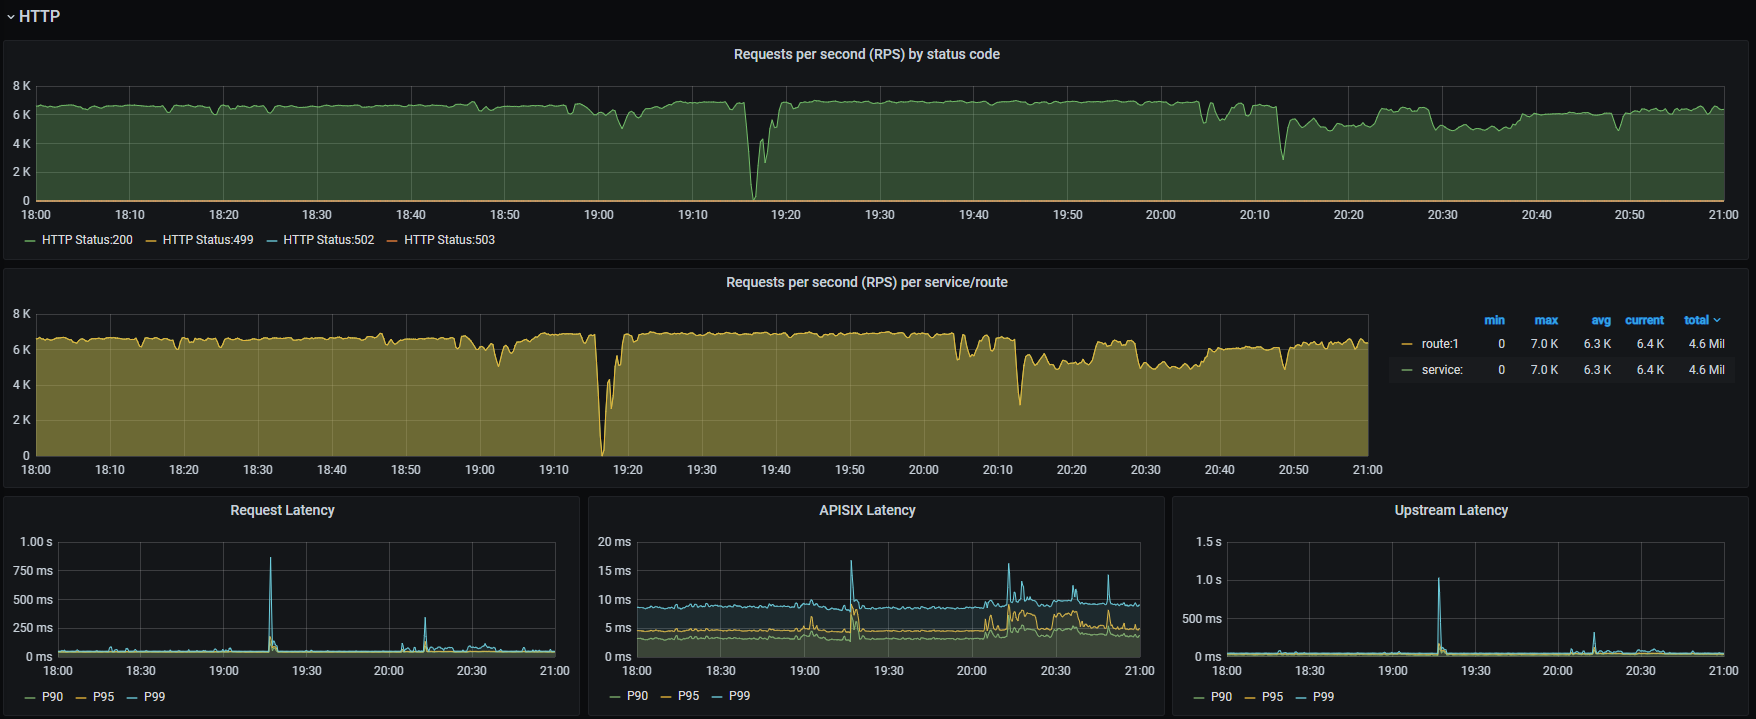
Metrics exported by the plugin can be graphed in Grafana using a drop in dashboard.
Downloads Grafana dashboard meta and imports it to Grafana。
Or you can goto Grafana official for Grafana meta data.

Available metrics#
Status codes: HTTP status code returned from upstream services. These status code available per service and across all services.Attributes:
Name Description code The HTTP status code returned by the upstream service. route The route_idof the matched route is request. If it does not match, the default value is an empty string.matched_uri The uriof the route matching the request, if it does not match, the default value is an empty string.matched_host The hostof the route that matches the request. If it does not match, the default value is an empty string.service The service_idof the route matched by the request. When the route lacks service_id, the default is$host.consumer The consumer_nameof the consumer that matches the request. If it does not match, the default value is an empty string.node The ipof the upstream node.Bandwidth: Total Bandwidth (egress/ingress) flowing through APISIX. The total bandwidth of per service can be counted.Attributes:
Name Description type The type of bandwidth(egress/ingress). route The route_idof the matched route is request. If it does not match, the default value is an empty string..service The service_idof the route matched by the request. When the route lacks service_id, the default is$host.consumer The consumer_nameof the consumer that matches the request. If it does not match, the default value is an empty string.node The ipof the upstream node.etcd reachability: A gauge type with a value of 0 or 1, representing if etcd can be reached by a APISIX or not, where1is available, and0is unavailable.Connections: Various Nginx connection metrics like active, reading, writing, and number of accepted connections.Batch process entries: A gauge type, when we use plugins and the plugin used batch process to send data, such as: sys logger, http logger, sls logger, tcp logger, udp logger and zipkin, then the entries which hasn't been sent in batch process will be counted in the metrics.Latency: The per service histogram of request time in different dimensions.Attributes:
Name Description type The value can be apisix,upstreamorrequest, which means http latency caused by apisix, upstream, or their sum.service The service_idof the route matched by the request. When the route lacks service_id, the default is$host.consumer The consumer_nameof the consumer that matches the request. If it does not match, the default value is an empty string.node The ipof the upstream node.Info: the information of APISIX node.
Here is the original metric data of APISIX:
Disable Plugin#
Remove the corresponding json configuration in the plugin configuration to disable prometheus.
APISIX plugins are hot-reloaded, therefore no need to restart APISIX.